Hi, In this article we will see all about the Python Matplotlib library. I will highly recommend you bookmark this page for further useful Python Matplotlib tutorials.
In today’s data-driven world, the ability to effectively visualize data is paramount. Whether you’re a data scientist, researcher, or developer, conveying insights from data through compelling visualizations is essential for decision-making and communication. Fortunately, Python offers a powerful tool for creating visualizations called Matplotlib. In this article, we’ll look into Matplotlib, exploring its features and demonstrating how to create stunning visualizations to unlock insights from your data.
Headings of Contents [hide]
What is Matplotlib in Python?
Matplotlib is a versatile and widely-used plotting library for Python, originally developed by John D. Hunter in 2003. Since then, it has become the standard tool for creating static, interactive, and animated visualizations in Python. Built on NumPy arrays, Matplotlib is tightly integrated with the broader scientific computing ecosystem in Python, making it a go-to choice for data visualization tasks.
Key Features of Matplotlib
Wide range of plot types: Matplotlib supports various plot types, including line plots, scatter plots, bar charts, histograms, pie charts, contour plots, heat maps, 3D plots, and more. This versatility allows users to visualize different types of data across diverse domains.
- Publication-quality output: Matplotlib is designed to produce high-quality, publication-ready figures with customizable formatting options. Users have fine-grained control over plot aesthetics, including colors, line styles, markers, fonts, and annotations, enabling them to create professional-looking visualizations.
- Pythonic interface: Matplotlib provides a Pythonic interface for creating plots, making it accessible and easy to learn for Python developers. Its syntax closely resembles that of other Python libraries, such as NumPy and Pandas, facilitating seamless integration with existing Python workflows.
- Customization and extensibility: Matplotlib offers extensive customization options, allowing users to tailor plots to specific requirements. With its object-oriented architecture, users can customize plot aesthetics, add annotations, create subplots, and combine multiple plots into a single figure. Additionally, Matplotlib’s extensibility enables the creation of custom plot types and functionalities.
- Integration with Jupyter Notebooks: Matplotlib integrates seamlessly with Jupyter Notebooks, a popular tool for interactive computing and data analysis in Python. Users can generate plots directly within Jupyter Notebooks and interactively explore and manipulate data using Matplotlib’s interactive features.
Why should we use Matplotlib in Python?
Using Matplotlib in Python offers several advantages for data visualization tasks:
- Ease of Use: Matplotlib provides a simple and intuitive interface for creating a wide range of plots. Its syntax closely resembles that of other Python libraries, such as NumPy and Pandas, making it easy for Python developers to get started with data visualization.
- Versatility: Matplotlib supports various plot types, including line plots, scatter plots, bar charts, histograms, pie charts, contour plots, heat maps, 3D plots, and more. This versatility allows users to visualize different types of data across diverse domains.
- Publication-Quality Output: Matplotlib is designed to produce high-quality, publication-ready figures with customizable formatting options. Users have fine-grained control over plot aesthetics, including colors, line styles, markers, fonts, and annotations, enabling them to create professional-looking visualizations.
- Integration with Python Ecosystem: Matplotlib is tightly integrated with the broader scientific computing ecosystem in Python. It works seamlessly with other Python libraries, such as NumPy, Pandas, and SciPy, allowing users to easily incorporate data manipulation and analysis tasks into their visualization workflows.
- Customization and Extensibility: Matplotlib offers extensive customization options, allowing users to tailor plots to specific requirements. With its object-oriented architecture, users can customize plot aesthetics, add annotations, create subplots, and combine multiple plots into a single figure. Additionally, Matplotlib’s extensibility enables the creation of custom plot types and functionalities.
- Interactive Visualization: Matplotlib supports interactive features that enable users to explore and manipulate data interactively. This is particularly useful for exploratory data analysis and interactive presentations.
Getting Started with Python Matplotlib
To work with Python Matplotlib, you first need to install the library using Python pip, Python’s package manager.
Use the below command to install Matplotlib in your Python environment.
Once installed, you can import Matplotlib into your Python scripts or Jupyter Notebooks using the following import statement.
With Matplotlib imported, you can start creating plots using its pyplot interface. Let’s dive into a basic plot creation example to illustrate how easy it is to get started with Matplotlib.
import matplotlib.pyplot as plt

# Sample data
x = [1, 2, 3, 4, 5]
y = [2, 3, 5, 7, 11]

# Create a line plot
plt.plot(x, y)

# Add labels and title
plt.xlabel('X-axis')
plt.ylabel('Y-axis')
plt.title('Line Plot')

# Display the plot
plt.show()
The Output of the above code will be:
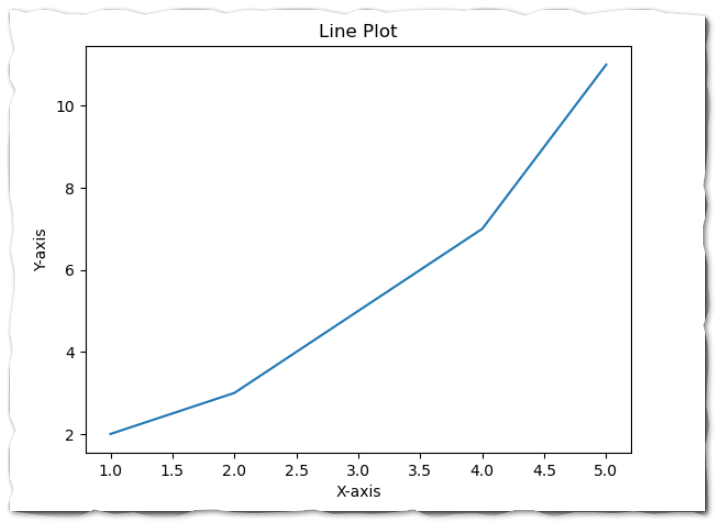
In this example, we import matplotlib’s pyplot module as plt and create a line plot using the plt.plot() method. We then customize the plot by adding axis labels and a title with the help of plt.xlabel(), plt.ylabel(), and plt.title() functions, respectively. Finally, we display the plot using the plt.show() function.
Matplotlib Tutorial Index
Matplotlib Basic Charts
Matplolib Problems
Conclusion
In conclusion, Matplotlib is a powerful and flexible plotting library that provides Python developers with the tools they need to create informative and visually appealing visualizations. Whether you’re a data scientist, researcher, or developer, Matplotlib offers a comprehensive suite of plotting functionalities to meet your data visualization needs. By mastering Matplotlib, you can unlock insights from your data and communicate your findings effectively through compelling visualizations.
If you found this article helpful, Please share and keep visiting for further Matplotlib tutorials.

